Performance Against Goal
Performance Summary 2024
Total water consumption
Total Water Withdrawal by Source
Net water consumption Intensity per Revenue Unit
Amount of Treated Wastewater
Proportion of Water Withdrawal from the Company’s Operation Sites with Water Stress
Risks and Opportunities
Climate change is increasingly affecting global water availability, leading to more frequent and severe droughts, floods, saltwater intrusion, and water scarcity in many regions. Efficient water conservation to address changing climate patterns is a critical management issue to ensure the efficient use and equitable distribution of this precious resource.
CP ALL recognizes the importance of effective water management. Water is a fundamental resource essential for both business operations and human life. A lack of effective water management can not only impact operations and disrupt the supply chain but also damage the company’s reputation and pose risks of violating human rights to water and sanitation. Conflicts between the company and surrounding communities may arise as a result.
Management Approach
To achieve sustainable water management and minimize environmental impacts from our operations, CP All has established environmental policies and water stewardship practices. These ensure our business operations balance water usage with the needs of communities and nature. We have set an ambitious long-term target to reduce water consumption per revenue by 20% by 2030 compared to the 2020 baseline. Additionally, we assess water-related risks and opportunities, develop plans to mitigate water scarcity, and implement measures to improve water efficiency and conservation. We promote effective water management throughout our organization, support the adoption of water recycling technologies, and raise awareness among employees and stakeholders about water conservation through training, knowledge sharing, and campaigns. We also collaborate with communities and stakeholders to address water-related challenges at the national level and disclose our water performance annually in our sustainability reports.
Sustainable Water Use Assessment
CP ALL continuously collects, monitors, reviews, and analyzes data on water consumption and quality across all operational areas, including manufacturing facilities, distribution centers, 7-Eleven stores, Makro and Lotus sales centers, and offices. Assessments are conducted quarterly using three primary methods: 1) For manufacturing, and distribution facilities, water risk assessments are conducted according to ISO 14001:2015 standards. In 2024, CP Ram’s facilities in Ladlumkaew, Boen, Ladkrabang, Chonburi, Surat Thani, Khon Kaen, and Lamphun were ISO 14001:2015 certified. 2) For facilities located in industrial estates, wastewater treatment and water efficiency are assessed by the Industrial Estate Authority of Thailand (IEAT) or independent third-party auditors according to international standards such as ISO 14001:2015, industry-specific standards, and estate-specific standards. 3) For sales centers and offices not located in industrial estates, our central greenhouse gas management unit assesses water management practices to identify opportunities for improvement and reduce impacts on water resources and ecosystems.
Water Consumption in 2024
| Unit | FY 2021 | FY 2022 | FY 2023 | FY 2024 | Target for FY 2024 | |
|---|---|---|---|---|---|---|
| A. Water withdrawal (excluding saltwater) | Million cubic meters | 17.21 | 20.42 | 22.68 | 24.57 | |
| B. Water discharge (excluding saltwater) | Million cubic meters | 11.25 | 13.06 | 14.67 | 15.93 | |
| Total net fresh water consumption (A-B) | Million cubic meters | 5.96 | 7.36 | 8.01 | 8.64 | 9.00 |
| Data coverage | percentage of: Revenue | 95.52 | 100 | 100 | 100 |
Water Conservation Project
The Company recognizes that efficient water use helps mitigate impacts on ecosystems, such as reducing wastewater discharge and conserving natural water resources. Therefore, the Company has established an environmental policy and guidelines on water resource management to ensure the business operations balance water use with the needs of communities and nature. Additionally, the Company has set the target of “reducing water use per revenue by 20% by 2030 compared to the 2020 baseline.” The Company continuously collects, audits, reviews, and analyzes data on water usage and water quality across all operational areas, including manufacturing plants, distribution centers, 7-Eleven stores, Makro Wholesale Stores, Lotus’s Stores, and various offices, with quarterly evaluations conducted as follows:
In 2024, the Company implemented efficient water management practices and wastewater recycling programs, reducing wastewater discharge into public waterways and natural sources through various initiatives categorized into four operational approaches, as follows:

Reducing water use
——–

Water efficiency and recycle wastewater
——–

Treated wastewater discharge
——–

Raising Awareness on Water Conservation and Efficient Water Usage
——–
1. Reducing water use
Project to Promote the Use of Water-saving Equipment
The Bang Bua Thong Distribution Center has upgraded the sanitary ware, sinks, and toilets on the 1st and 2nd floors of the office to water-saving models to enhance water conservation efficiency. This improvement can save more than 75 cubic meters of water per year.
Impacts and Benefits
Reduces municipal water usage by
2. Enhancing water efficiency and recycling wastewater under the ongoing project “Zero Wastewater Discharge”
Project to Enhance Water Efficiency in Production Processes
CPRAM Co., Ltd. at Lat Lum Kaeo utilizes naturally warm groundwater for cleaning production equipment to reduce electricity usage for heating water. CPRAM also treats wastewater from production processes to a quality exceeding the minimum legal standards, enabling complete reuse. Examples include using treated water as raw water for cooling tower systems, watering plants, and washing facility grounds.
Impacts and Benefits
Reduces municipal water usage by

Reduces electricity consumption by
Recycled wastewater utilization
Groundwater Bank Project
CP Axtra stores treated water for use during emergencies and redirects excess water into designated areas underground to reduce water consumption and support agricultural activities. This approach helps mitigate the impacts of water scarcity and strengthens relationships with local communities. The Company plans to expand this pilot project to other branches in the future.
Impacts and Benefits
Water treatment capacity exceeding

Diverted to underground water banks
Project for Reusing Condensate from Air Conditioning
Suvarnabhumi Distribution Center has installed storage tanks for collecting condensate water from air conditioners in the canteen area. This recycled water is used for activities such as watering plants, resulting in water savings of more than 40 cubic meters per year.
“Save Water, Save Future” Project
CP Axtra Public Company Limited has installed wastewater treatment systems at its distribution centers to recycle wastewater for watering plants. This reduces freshwater consumption and decreases water management expenses.
Impacts and Benefits

Number of participating distribution centers
Reduction in tap water consumption
Recycled wastewater utilization
3. Treated Wastewater Discharge System Improvement
Ongoing Project: Sharing Clean Water with Farmers
CPRAM Lamphun factory has sought permission to discharge treated wastewater from its production process, complying with factory wastewater standards as stipulated by the Ministry of Industry, for use by nearby rice farmers. This enables local farmers to have sufficient water for rice farming and supports off-season cultivation.
Impacts and Benefits
Reduced extraction of water from community sources by more than

Increased income for farmers by more than
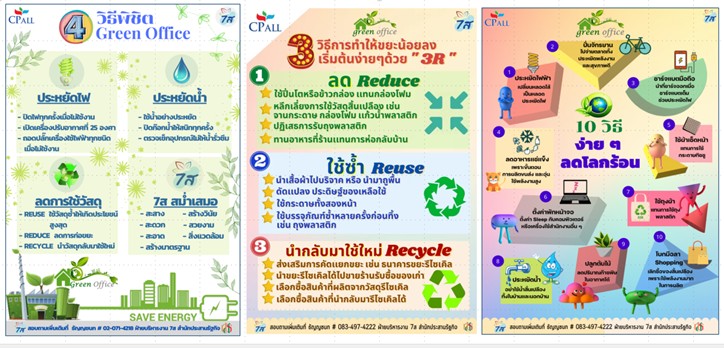
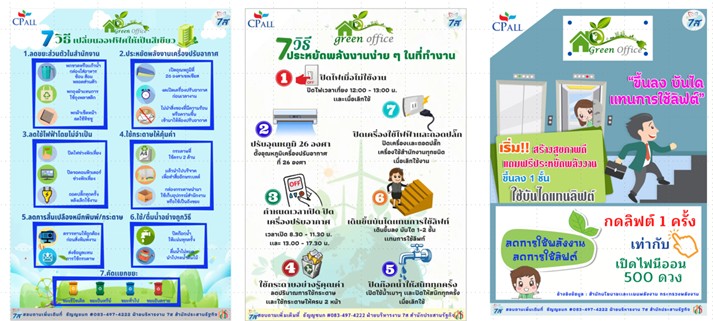
4. Raising Awareness on Water Conservation and Efficient Water Usage
CP ALL is conducting a comprehensive communication campaign to raise awareness among all employees at every level, including operational, distribution, and office staff, about the importance of water efficiency. To encourage employees to be mindful of water conservation and actively participate in preserving water resources, the company is promoting the 7S campaign, with a 2023 focus on “S for Environment,” emphasizing the conservation of natural resources through the 3R principle. Employees are encouraged to utilize resources efficiently and effectively by reducing energy and water consumption.
The campaign aims to raise awareness and foster behavioral changes among employees at all levels. Not only does it help reduce organizational costs, but it also demonstrates our commitment to social responsibility and environmental sustainability. Additionally, it contributes to a positive corporate culture and improved workplace efficiency.
Impacts and Benefits

Number of employees participating in the program
Water Risk Management
CPALL Supplier Water Risk Assessment and Management
CP ALL recognizes the critical importance of effective water management. Water is a fundamental resource essential for both business operations and human life. Ineffective water management can not only disrupt operations and supply chains but also damage our reputation and risk violating human rights related to water and sanitation, potentially leading to conflicts with local communities.
Water Risk Assessment throughout the Supply Chain
Additionally, the company conducts annual water stress risk assessments for all its operational areas and those of its Critical Tier 1 suppliers. These assessments identify risks associated with water scarcity, water overconsumption, and declining water quality. To accurately pinpoint operational areas located in water-stressed regions, the company utilizes the open-source Aqueduct Water Risk Atlas developed by the World Resources Institute (WRI). By inputting location data into the tool, CP ALL can precisely identify water stress areas, providing critical data for planning and decision-making. This information is used to develop mitigation measures and Business Continuity Plans (BCP) to prepare for unforeseen events. Furthermore, the assessments allow the company to quantify the overall impact of water risks on its operations.
1. Specify partner information, such as partner type, purchase value, and geographic coordinates
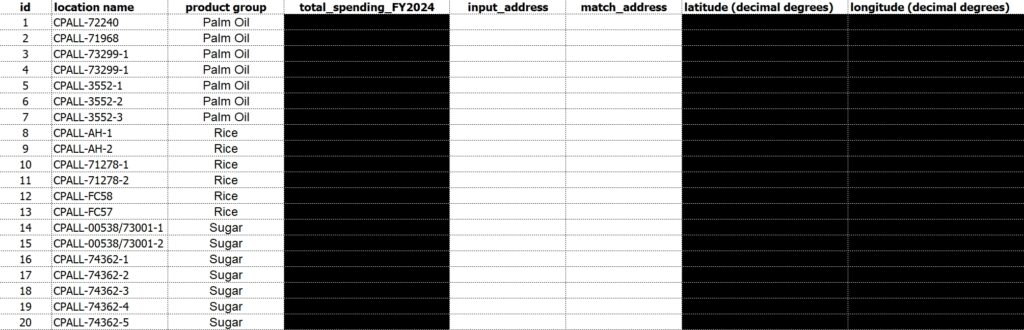
2. Enter the necessary data into the AQUEDUCT software
Additionally, CP ALL continuously monitors and assesses the water stress situation of its Critical Tier 1 suppliers to prevent and mitigate supply chain disruptions. This is achieved through regular water stress risk assessments of agricultural sourcing areas for key agricultural products such as cattle product, maize, palm oil, rice, soybeans, sugar, tobacco, and cotton. By inputting the locations of Critical Tier 1 suppliers’ production facilities into the Aqueduct Water Risk Atlas, the company can identify high-risk areas for water stress among its suppliers
3. AQUEDUCT processes data and generates an Excel output
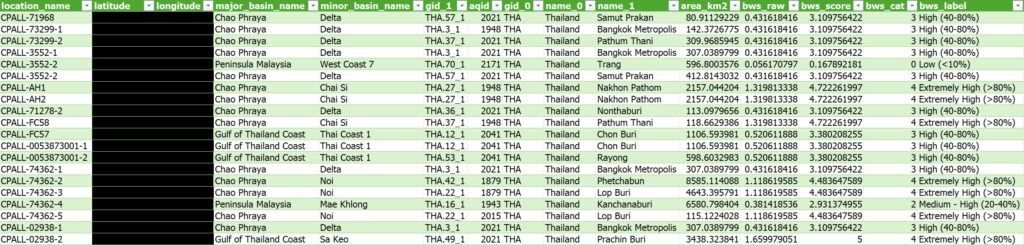
4. CP ALL analyzes water stress risk data to map water-stressed regions
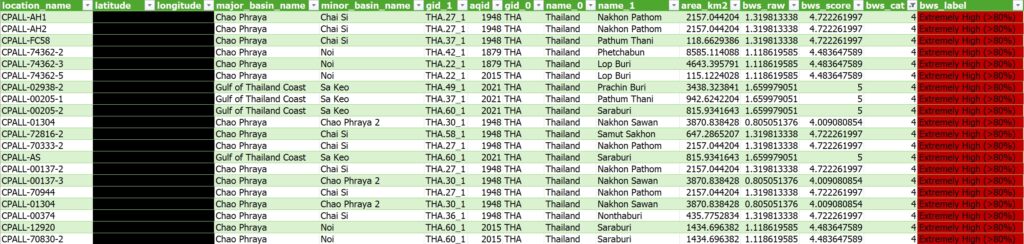
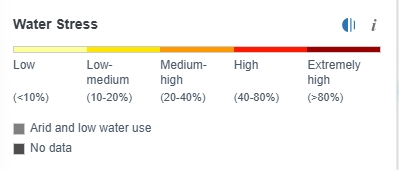
*Definitions of water-stressed areas as follows: Extremely High (>80%) Risk areas, as mapped by WRI’s Aqueduct Global Water Tool
In 2024, the Aqueduct Water Risk Atlas assessment revealed that 35.45% of its Critical Tier 1 suppliers’ operational areas fall into the same category.
Percentage of partner operations Proportion of raw materials purchased in water-stressed areas
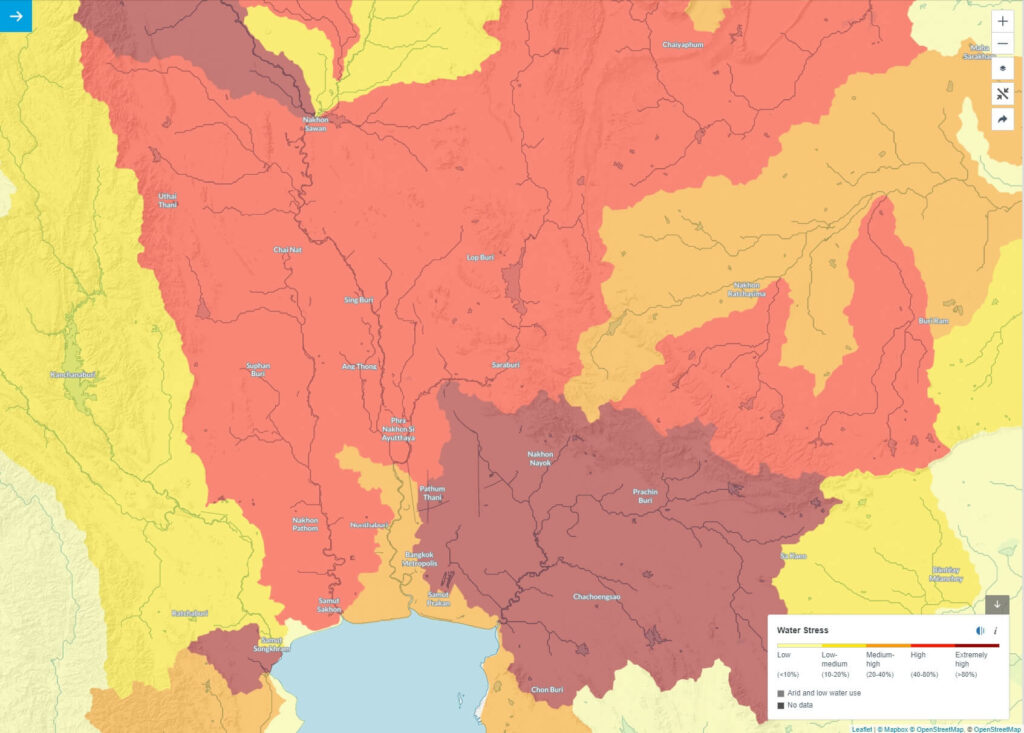
The analysis revealed that 46 Critical Tier 1 suppliers , primarily involved in cattle product, rice, soybeans, and sugar, were located in extremely high water-stress areas. The primary sourcing regions for these products were Chiang Mai, Nakhon Pathom, Pathum Thani, Phetchabun, Lop Buri, Prachin Buri, Sara Buri, Nakhon Sawan, Samut Sakhon, Nontha Buri provinces. In the previous fiscal year, the total cost of goods purchased from suppliers located in water-stressed areas accounted for 35.45% of the overall agricultural product cost.
Risk Assessment Summary
| % of sourced agricultural commodities originating from water-stressed areas | |
|---|---|
| Cattle Products | 61.59% |
| Maize | 26.17% |
| Palm Oil | 24.07% |
| Rice | 36.23% |
| Soy | 42.64% |
| Sugar | 10.82% |
| Tobacco | 00.00% |
| Cotton | 00.00% |
| % of Cost of goods Purchased in last FY (if applicable) | 35.45% |
Supplier Water Risk Management
The Company collaborates with critical Tier-1 suppliers whose operations are located in water-risk areas to develop risk mitigation plans, categorized into three operational approaches as follows:
Quantity and quality of water
Regulatory changes
Stakeholder conflicts
Quantity and quality of water
Self-assessment: The Company develops and distributes a Water Self-Assessment form to suppliers through the sustainable sourcing program. This assessment is used to identify water sources and evaluate measures for managing water quantity and quality risks
Collaboration and capacity building: The Company collaborates with critical Tier-1 suppliers operating in water-risk areas and relevant government agencies to promote sustainable water management and raise awareness of efficient water usage. It also provides training to farmer-supplier groups, encourages the adoption of water-saving technologies, water recycling, and improvements in processes to reduce water usage
Good Agricultural Practices (GAP): The Company supports farmer-supplier groups in adopting GAP principles to enhance transparency and sustainability in agricultural production processes
Regulatory changes
Regulatory Monitoring: The Legal Department closely monitors changes in laws, regulations, and policies relevant to the business. If changes occur that may impact business operations, the Legal Department will notify the Procurement Department to communicate and jointly prepare contingency plans with critical Tier-1 suppliers. This is accompanied by support for suppliers with sustainable procurement practices to develop production processes and alternative sourcing, reducing organizational risks associated with reliance on suppliers lacking risk mitigation measures that could lead to future violations of laws, regulations, and standards
Industry Participation: The Company collaborates with various associations, networks, government agencies, private sector organizations, and experts to exchange policy information and operational approaches. This helps mitigate impacts from business activities and raises awareness among suppliers operating in water-risk areas
Stakeholder conflicts
Stakeholder engagement: The Company provides channels for gathering feedback and suggestions from communities near the operational areas of critical Tier-1 suppliers in water-risk areas, as well as from its own operational areas that could potentially face conflicts. It continuously communicates information regarding the water situation and risk mitigation plans
Joint water risk mitigation: The Company collaborates with partners to legally, effectively, and appropriately mitigate water risks by developing water risk mitigation plans together with relevant agencies and communities
Supplier complaint monitoring: The Company monitors and records supplier complaints through annual factory inspections and supplier assessment processes. If any complaints are identified, suppliers are required to implement corrective actions before engaging in future business activities. The procurement and quality assurance departments are responsible for following up on these corrective actions
In 2024, CPALL's partnership with its Critical Tier 1 supplier in a high-water-stressed area in Prachin Buri province. The collaboration involves working with relevant government agencies and communities to develop plans for mitigating risks related to water quantity and quality. CPALL has signed contracts with its water providers to excavate a water reservoir, which will directly supply water to CPALL's Critical Tier 1 suppliers' factories.
| Wastewater Treatment System | CPALL has worked with this Critical Tier 1 supplier to enhance the wastewater treatment system to enable water reuse. |
| Water Reclaim Program | CPALL has also encouraged this supplier to establish a “Water Reclaim Program” that utilizes recycled water stored in their retention pond for use in utilities such as boilers, chillers, and ice banks. |
| FI Program | CPALL has supported the Critical Tier 1 supplier in improving their water consumption efficiency through the "FI Program," which deploys new technologies to control processes in factory systems, enhancing water usage in the processing system more effectively. |
| Rainwater Storage Ponds | CPALL has encouraged this Critical Tier 1 supplier to expand the rainwater storage ponds within their operational areas in Prachin Buri province to conserve water for use during summer or drought seasons. These collaborative programs help reduce water consumption. This collaboration can mitigate the impact of risks related to water quantity and quality. |
Other Information
Performance Data of Water Stewardship
| GRI Standared | Required Data | Unit | 2020 | 2021 | 2022 | 2023 |
|---|---|---|---|---|---|---|
| 303-3 (a) 2018 | Total water withdrawal | Million m3 | 16.68 | 15.86 | 18.79 | 21.00 |
| - Groundwater | Million m3 | 1.48 | 1.39 | 1.40 | 1.29 | |
| - Third-Party Water | Million m3 | 15.20 | 14.47 | 17.39 | 19.71 | |
| - Surface municipal water | Million m3 | 15.06 | 14.26 | 17.23 | 19.51 | |
| - Groundwater municipal water | Million m3 | 0.14 | 0.21 | 0.16 | 0.20 | |
| 303-3 (b) 2018 | Total water withdrawal from water stress area | Million m3 | 4.87 | 4.58 | 8.52 | 7.11 |
| - Groundwater | Million m3 | 1.32 | 1.23 | 1.27 | 1.09 | |
| - Third-Party Water | Million m3 | 3.55 | 3.35 | 7.24 | 6.02 | |
| - Surface municipal water | Million m3 | 3.48 | 3.23 | 7.14 | 5.85 | |
| - Groundwater municipal water | Million m3 | 0.07 | 0.12 | 0.10 | 0.17 | |
| 303-3 (b) 2018 | Total freshwater withdrawal | Million m3 | 16.66 | 15.83 | 18.79 | 19.91 |
| - Freshwater (<=1,000 mg/L Total Dissolved Solids) | Million m3 | 16.66 | 15.83 | 18.79 | 19.91 | |
| - Reused and recycled water | Million m3 | 0.75 | 0.41 | 0.39 | 0.76 | |
| Net water use intensity per revenue unit | m3per million Baht | 14.26 | 9.26 | 7.93 | 8.07 | |
| 303-4 (a) 2018 | Water discharge | Million m3 | 8.89 | 10.42 | 12.03 | 13.56 |
| 303-4 (b) 2018 | Treated wastewater discharged into the environment through the ground (TDS ≤ 1,000 mg/L) | Million m3 | 0.19 | 0.74 | 0.16 | 0.17 |
| - COD | mg/L | 485.00 | 205.44 | 40.07 | 40.00 | |
| kg | 7,657.68 | 60,793.06 | 6,546.79 | 6,830.59 | ||
| - BOD | mg/L | 60.80 | 63.97 | 2.18 | 2.24 | |
| kg | 997.88 | 22,578.32 | 356.91 | 383.23 | ||
| - Total dissolved solids (TDS) | mg/L | 3,889.00 | 919.23 | 531.80 | 549.29 | |
| kg | 62,495.02 | 169,244.54 | 86,887.51 | 93,798.95 | ||
| 303-4 (b) 2018 | Treated wastewater discharged into the environment through the ground (TDS >1,000 mg/L) | Million m3 | 0.43 | N/A | N/A | N/A |
| - COD | mg/L | 2,537.80 | N/A | N/A | N/A | |
| kg | 90,169.59 | N/A | N/A | N/A | ||
| - BOD | mg/L | 775.73 | N/A | N/A | N/A | |
| kg | 27,653.85 | N/A | N/A | N/A | ||
| - Total dissolved solids (TDS) | mg/L | 16,279.33 | N/A | N/A | N/A | |
| kg | 581,18O.73 | N/A | N/A | N/A | ||
| 303-4 (b) 2018 | Treated wastewater discharged into the environment through the ground send 3rd party (TDS <=1,000 mg/L) | Million m3 | N/A | N/A | 0.25 | 0.30 |
| - COD | mg/L | N/A | N/A | 89.28 | 92.51 | |
| kg | N/A | N/A | 12,622.52 | 27,927.46 | ||
| - BOD | mg/L | N/A | N/A | 15.94 | 17.77 | |
| kg | N/A | N/A | 2,519.93 | 5,364.51 | ||
| - Total dissolved solids (TDS) | mg/L | N/A | N/A | 1,400.69 | 577.14 | |
| kg | N/A | N/A | 143,541.21 | 168,195.91 | ||
| 303-4 (b) 2018 | Treated wastewater discharged into the environment through the ground send 3rd party (TDS >1,000 mg/L) | Million m3 | N/A | N/A | 0.36 | 0.41 |
| - COD | mg/L | N/A | N/A | 422.85 | 40.97 | |
| kg | N/A | N/A | 153,905.29 | 16,859.08 | ||
| - BOD | mg/L | N/A | N/A | 42.12 | 7.60 | |
| kg | N/A | N/A | 15,330.82 | 3,129.32 | ||
| - Total dissolved solids (TDS) | mg/L | N/A | N/A | 1,211.08 | 1,334.97 | |
| kg | N/A | N/A | 440,835.69 | 549,345.27 | ||
| 303-5 | Net water consumption | Million m3 | 7.79 | 5.44 | 6.76 | 7.44 |