Performance Against Goal
Performance Summary 2024
Gender Diversity
| Total (persons) | FTEs (%) | |
|---|---|---|
 Male Male |
||
 Female Female |
Age Diversity
| Number (persons) | FTEs (%) | |
|---|---|---|
 Under 30 years old Under 30 years old |
||
 30-50 years old 30-50 years old |
||
 Over 50 years old Over 50 years old |
Nationality Diversity
| Share in total workforce (%) | Share in all management positions (%) | |
|---|---|---|
 Thai Thai |
||
 Cambodian Cambodian |
||
 Burmese Burmese |
||
 Korean Korean |
||
 Indian Indian |
||
 Australian Australian |
||
 Other Other |
Promoting equal opportunities and diversity for employees
Capability Building of Female Employees
People with Disability

Number
FTEs
Freedom of Association
The Welfare Committee of the Company’s workforce
Management Approach
Corporate Culture
CP ALL believes that corporate culture is the “organization’s life force” that makes the organization strong and enables it to grow sustainably. Therefore, the principles of working together on the basis of values or guidelines for working together are divided as follows.
The Company’s desired employee competencies
1.Achievement (love work)
2.Customer Service Orientation (love customers)
3.Integrity (love honesty)
4.Organization Commitment (love organization)
5.Team Work and Cooperation (love team)
The Company’s desired shared values
strength / courage / verbal honesty / unity / generosity / respecting others / enjoying beauty of life
Essential Leader Skills
Junior Management : sincerity / non-arrogance / verbal consciousness / non-power abusive
Middle Management : good role modeling / possessing fairness / merciful / decisive
Top Management : societal care / cultivating good people / open mindedness
“Our Way” To continue for sustainable growth in the next 30 years with “Our Way.”
CP ALL is aware of external changes that are changing rapidly and drastically than the past. The company has therefore mobilized the brainstorming from more than 4,000 executives and representatives to find ways to create sustainable growth for at least 30 years. The results from brainstorming, it enables the company to receive important and necessary values for sustainable growth called “Our Way” (5 development), consisting of “TRUST,” “COACHING,” “INNOVATION,” “SMART,” and “COMMUNITY AWARENESS.”
Respect for Diversity and Inclusion
Respect for diversity and inclusion remains the Company’s commitment, emphasizing equal treatment which does not discriminate based on nationality, skin color, religion, gender, sexual preferences, citizenship, age, disability, or other characteristics considered to be a human right. By managing diversity and accepting differences in an appropriate manner, with believes that it is able to attract and retain people who are capable and good, as well as bring out and make use of the best potential and capabilities from employees. In this regard, the Company has established the Diversity and Inclusion Policy and Guidelines with the aim to mutually benefit its business operations and employees as follows:
Fair treatment of labor
The Company considers labor rights and fair treatment of employees in accordance with laws and policies under both Thai and international labor protection acts. Additionally, the Company also considers appropriate employment practices, wages, working hours, holidays, and benefits, as well as a safe working environment with good conditions. The Company provides employee benefits including:
Regularly engage with workers' representatives on working conditions
The company places importance on regular communication and discussion with employee representatives through the Welfare Committee, which is composed of representatives from both management and employees.
The committee meets regularly every quarter to discuss key issues, such as:
Additionally, the committee provides an opportunity for employee representatives to provide feedback and suggestions before new policies that affect employees are announced, for example, performance evaluation policies or work regulations.
The purpose of this process is to listen to direct feedback from employees, which helps build relationships and trust, and ensures that policies are appropriate and fair.
Monitor working hours including overtime management
To ensure that employee working hours comply with internal policies and labor law requirements, which helps provide fair and accurate compensation while promoting employee well-being, CP All implements a systematic process as follows:
The committee meets regularly every quarter to discuss key issues, such as:
Notice period before mass termination
The company values employee rights and fair labor practices. In accordance with Section 17 of the Labor Protection Act B.E. 2541 (1998), in cases where it is necessary to terminate an employee's employment due to business reasons, the company will provide a notice of termination at least one pay period (generally 30 days) before the effective date of termination. An exception applies in cases of serious misconduct by the employee, as stipulated in Section 119 of the Labor Protection Act B.E. 2541 (1998), where no advance notice is required. If the company is unable to provide notice within the specified period, it will pay "payment in lieu of advance notice" to the employee, equivalent to the wages for the period for which notice should have been given.
Employee Benefits and Welfare
| Employee Benefits | Legal rights | Rights that the Company provides to employees |
|---|---|---|
| Paid parental leave for the primary caregiver Employee Benefits | 98 Days | 120 Days |
| Paid parental leave for the non-primary caregiver | 0 Days | 7 Days |
| Leave for the care of an adopted child for employees with diverse sexual orientations | 0 Days | 7 Days |
| Public holidays | Not less than 13 days per year | 14-18 Days |
| Annual leave | Not less than 6 days per year | 6-12 Days |
| Business Leave | 3 Days | 3-7 Days |
| Personal leave for personal matters to promote work-life balance | - | 7 days of paid leave, not including holidays that fall between the leave period |
Besides the benefits provided in accordance with legal requirements and internal policies, the Company also offers a comprehensive and diverse range of employee benefits to promote well-being throughout their employment with the Company. These include housing rent assistance, hardship allowances for employees working at branch offices in remote areas, and life security benefits such as provident funds, life insurance covering illness and accidents, and voluntary group health insurance that extends coverage to employees and their families. Additional benefits include emergency loan programs for employees and their families, as well as financial assistance in cases of natural disasters.
The Company prioritizes the health of employees by providing health services through the CPALL Health Care Center and a fitness center for employees (The Tara Fitness Club), offering training by experts in various fields, and promoting employees’ overall well-being. The Company also provides health check-ups by pharmacists using modern equipment through the ‘Exercise My Way’ program and organizes the ‘Good Health & Happy Family CP ALL 2024’ activities.
Remark: The key areas for providing support cover employees working in office areas, distribution centers, and 7-Eleven store operations.
These flexibility and benefits Helps boost employee morale, increase productivity, reduce absenteeism, and help attract Including retaining talented personnel with the organization Reduce employee turnover rate As a result, the company was able to improve its financial performance and non-financial results.
New Employee Hires with breakdown
| GRI standard | Required Data | Unit | 2021 | 2022 | 2023 | 2024 | |||||||||||
| Male | Female | Total | Male | Female | Total | Male | Female | Total | Male | Female | Total | ||||||
| 404-1 | New Employee Hires | ||||||||||||||||
| Number of new hires | Persons | 33,670 | 58,673 | 92,343 | 36,230 | 63,223 | 99,453 | 34,420 | 62,351 | 96,771 | 47,956 | 74,895 | 122,851 | ||||
| New hire rate | % | 59.79 | 59.41 | 53.43 | 60.01 | ||||||||||||
| By age | |||||||||||||||||
| - Under 30 years old | Persons | 27,102 | 45,360 | 72,462 | 30,217 | 50,945 | 81,162 | 28,560 | 50,151 | 78,711 | 40,676 | 60,416 | 101,092 | ||||
| FTE | N/A | N/A | N/A | N/A | N/A | N/A | 27,705 | 47,252 | 74,957 | 41,028 | 59,410 | 100,437 | |||||
| - 30-50 years old | Persons | 6,510 | 13,155 | 19,665 | 5,924 | 12,166 | 18,090 | 5,811 | 12,102 | 17,913 | 7,194 | 14,314 | 21,508 | ||||
| FTE | N/A | N/A | N/A | N/A | N/A | N/A | 5,932 | 12,033 | 17,965 | 7,556 | 14,701 | 22,258 | |||||
| - Over 50 years old | Persons | 58 | 158 | 216 | 89 | 112 | 201 | 49 | 98 | 147 | 86 | 165 | 251 | ||||
| FTE | N/A | N/A | N/A | N/A | N/A | N/A | 50 | 105 | 155 | 91 | 178 | 269 | |||||
| By nationality | |||||||||||||||||
| - Thai | Persons | 32,843 | 58,054 | 90,897 | 35,511 | 62,537 | 98,048 | 33,493 | 61,537 | 95,030 | 25,101 | 42,826 | 67,927 | ||||
| FTE | N/A | N/A | N/A | N/A | N/A | N/A | 32,512 | 58,392 | 90,904 | 24,582 | 40,493 | 65,075 | |||||
| - Cambodian | Persons | 60 | 68 | 128 | 438 | 373 | 811 | 642 | 586 | 1,228 | 243 | 229 | 472 | ||||
| FTE | N/A | N/A | N/A | N/A | N/A | N/A | 804 | 706 | 1,510 | 306 | 284 | 590 | |||||
| - Burmese | Persons | 752 | 548 | 1ม300 | 236 | 307 | 543 | 265 | 218 | 483 | 240 | 204 | 444 | ||||
| FTE | N/A | N/A | N/A | N/A | N/A | N/A | 353 | 280 | 633 | 271 | 237 | 508 | |||||
| - Korean | Persons | 2 | 0 | 2 | 1 | 0 | 1 | 1 | 1 | 2 | 3 | 1 | 4 | ||||
| FTE | N/A | N/A | N/A | N/A | N/A | N/A | 0.98 | 0.98 | 2 | 3 | 1 | 4 | |||||
| - Indian | Persons | 1 | 0 | 1 | 30 | 3 | 33 | 3 | 0 | 3 | 19 | 0 | 19 | ||||
| FTE | N/A | N/A | N/A | N/A | N/A | N/A | 2.94 | 0 | 3 | 20 | 0 | 20 | |||||
| - Australian | Persons | 0 | 0 | 0 | 1 | 0 | 1 | 0 | 0 | 0 | 0 | 0 | 0 | ||||
| FTE | N/A | N/A | N/A | N/A | N/A | N/A | 0 | 0 | 0 | 0 | 0 | 0 | |||||
| - Other | Persons | 12 | 3 | 15 | 13 | 3 | 16 | 16 | 9 | 25 | 22,350 | 31,635 | 53,985 | ||||
| FTE | N/A | N/A | N/A | N/A | N/A | N/A | 16 | 10 | 26 | 23,492 | 33,274 | 56,766 | |||||
| By Management Level | |||||||||||||||||
| - Top Management | Persons | N/A | N/A | N/A | 8 | 4 | 12 | 9 | 14 | 23 | 7 | 6 | 13 | ||||
| FTE | N/A | N/A | N/A | N/A | N/A | N/A | 9 | 14 | 23 | 6 | 6 | 13 | |||||
| - Management | Persons | N/A | N/A | N/A | 243 | 318 | 561 | 167 | 141 | 308 | 111 | 131 | 242 | ||||
| FTE | N/A | N/A | N/A | N/A | N/A | N/A | 164 | 138 | 301 | 131 | 365 | 496 | |||||
| - Junior Management | Persons | N/A | N/A | N/A | 319 | 451 | 770 | 161 | 207 | 368 | 209 | 268 | 477 | ||||
| FTE | N/A | N/A | N/A | N/A | N/A | N/A | 158 | 204 | 363 | 271 | 271 | 542 | |||||
| - Officer | Persons | N/A | N/A | N/A | 35,660 | 62,450 | 98,110 | 34,083 | 61,989 | 96,072 | 47,629 | 74,490 | 122,119 | ||||
| FTE | N/A | N/A | N/A | N/A | N/A | N/A | 33,357 | 59,033 | 92,390 | 73,881 | 73,881 | 147,762 | |||||
| Average Hiring cost | |||||||||||||||||
| Average Hiring cost | Baht | 126,476,690 | 12,427,949 | 138,904,639 | 117,502,936 | 185,366,028 | 302,868,964 | N/A | N/A | 266,208,414 | 190,798,862 | 20,825,145 | 211,624,008 | ||||
Average Hiring Cost/FTE (Baht)
| 2021 | 2022 | 2023 | 2024 | |
|---|---|---|---|---|
| Hiring Cost |
Positions Opened by Internal Employees (%)
| 2021 | 2022 | 2023 | 2024 |
|---|---|---|---|
Employee turnover rate which breakdown
| GRI standard | Required Data | Unit | 2021 | 2022 | 2023 | 2024 | ||||||||||||
| Male | Female | Total | Male | Female | Total | Male | Female | Total | Male | Female | Total | |||||||
| 401-1 | Turnover | |||||||||||||||||
| Total number of resigned employees | Persons | 28,774 | 51,804 | 80,241 | 36,349 | 61,112 | 97,461 | 30,937 | 55,264 | 86,201 | 19,303 | 33,970 | 53,273 | |||||
| Turnover Rate | % | 52.40 | 58.66 | 48.27 | 40.14 | |||||||||||||
| By age | ||||||||||||||||||
| - Under 30 years old | Persons | 22,826 | 40,197 | 63,023 | 28,849 | 46,631 | 75,480 | 24,701 | 42,101 | 66,802 | 24,275 | 38,756 | 63,031 | |||||
| - 30-50 years old | Persons | 5,827 | 11,730 | 17,557 | 7,687 | 14,525 | 22,212 | 6,734 | 13,437 | 20,171 | 6,201 | 12,386 | 18,587 | |||||
| - Over 50 years old | Persons | 121 | 221 | 342 | 207 | 300 | 507 | 165 | 277 | 442 | 228 | 320 | 548 | |||||
| By nationality | ||||||||||||||||||
| - Thai | Persons | 28,437 | 51,804 | 80,241 | 36,349 | 61,112 | 97,461 | 30,937 | 55,264 | 86,201 | 19,303 | 33,970 | 53,273 | |||||
| - Cambodian | Persons | 131 | 157 | 288 | 177 | 168 | 345 | 379 | 346 | 725 | 236 | 205 | 441 | |||||
| - Burmese | Persons | 205 | 186 | 391 | 206 | 174 | 380 | 278 | 202 | 480 | 173 | 176 | 349 | |||||
| - Korean | Persons | 0 | 0 | 0 | 3 | 0 | 3 | 1 | 0 | 1 | 0 | 0 | 0 | |||||
| - Indian | Persons | 1 | 0 | 1 | 0 | 0 | 0 | 0 | 1 | 1 | 10 | 2 | 12 | |||||
| - Australian | Persons | 0 | 0 | 0 | 0 | 0 | 0 | 0 | 0 | 0 | 1 | 1 | 2 | |||||
| - Other | Persons | 0 | 1 | 1 | 8 | 2 | 10 | 5 | 2 | 7 | 10,981 | 17,108 | 28,089 | |||||
| By Management Level | ||||||||||||||||||
| - Top Management | Persons | 6 | 2 | 8 | 17 | 17 | 34 | 15 | 14 | 29 | 19 | 13 | 32 | |||||
| - Management | Persons | 194 | 212 | 406 | 266 | 351 | 617 | 238 | 272 | 510 | 200 | 222 | 422 | |||||
| - Junior Management | Persons | 311 | 547 | 858 | 619 | 954 | 1,573 | 541 | 892 | 1,433 | 471 | 808 | 1,279 | |||||
| - Non Management | Persons | 28,875 | 52,275 | 81,150 | 35,841 | 60,134 | 95,975 | 30,806 | 54,637 | 85,443 | 30,014 | 50,419 | 80,433 | |||||
Employee Voluntary turnover rate which breakdown
| GRI standard | Required Data | Unit | 2021 |
2022 |
2023 |
2024 |
||||||||||||
| Male | Female | Total | Male | Female | Total | Male | Female | Total | Male | Female | Total | |||||||
| 404-1 | Voluntary Turnover | |||||||||||||||||
| Number of voluntarily resigned employees | Persons | 26,340 | 48,587 | 74,927 | 31,669 | 55,312 | 86,981 | 23,930 | 43,539 | 67,469 | 24,439 | 42,385 | 66,824 | |||||
| Voluntary resignation rate | % | 42.52 | 51.96 | 37.25 | 32.64 | |||||||||||||
| By age | ||||||||||||||||||
| - Under 30 years old | Persons | 20,950 | 37,589 | 58,539 | 25,060 | 42,439 | 67,499 | 18,851 | 33,243 | 52,094 | 19,424 | 32,238 | 51,662 | |||||
| - 30-50 years old | Persons | 5,317 | 10,849 | 16,166 | 6,452 | 12,670 | 19,122 | 5,011 | 10,163 | 15,174 | 4,939 | 10,024 | 14,963 | |||||
| - Over 50 years old | Persons | 73 | 149 | 222 | 157 | 203 | 360 | 68 | 133 | 201 | 76 | 123 | 199 | |||||
| By nationality | ||||||||||||||||||
| - Thai | Persons | 22,005 | 48,243 | 74,248 | 31,277 | 54,969 | 86,246 | 23,531 | 43,149 | 66,680 | 18,635 | 33,078 | 51,713 | |||||
| - Cambodian | Persons | 130 | 157 | 287 | 177 | 168 | 345 | 275 | 272 | 547 | 235 | 205 | 440 | |||||
| - Burmese | Persons | 204 | 186 | 390 | 204 | 173 | 377 | 119 | 115 | 234 | 164 | 174 | 338 | |||||
| - Korean | Persons | 0 | 0 | 0 | 3 | 0 | 3 | 1 | 0 | 1 | 0 | 0 | 0 | |||||
| - Indian | Persons | 1 | 0 | 1 | 0 | 0 | 0 | 0 | 1 | 1 | 9 | 2 | 11 | |||||
| - Australian | Persons | 0 | 0 | 0 | 0 | 0 | 0 | 0 | 0 | 0 | 0 | 0 | 0 | |||||
| - Other | Persons | 0 | 1 | 1 | 8 | 2 | 10 | 4 | 2 | 6 | 5,396 | 8,926 | 14,322 | |||||
| By Management Level | ||||||||||||||||||
| - Top Management | Persons | 3 | 2 | 5 | 12 | 16 | 28 | 10 | 10 | 20 | 13 | 7 | 20 | |||||
| - Management | Persons | 170 | 198 | 368 | 244 | 324 | 568 | 159 | 193 | 352 | 112 | 126 | 238 | |||||
| - Junior Management | Persons | 278 | 476 | 754 | 558 | 854 | 1,412 | 396 | 656 | 1,052 | 350 | 570 | 920 | |||||
| - Non Management | Persons | 25,889 | 47,911 | 73,800 | 30,855 | 54,118 | 84,973 | 23,365 | 42,680 | 66,045 | 23,964 | 41,682 | 65,646 | |||||
Freedom of Association
The Company respects the freedom of expression and concerns of employees at all levels through various feedback channels such as emails, information reporting centers, the Company’s online media, the Voice of Employee system, and through the Welfare Committee in the workplace (Welfare Committee) established under the Labor Protection Act, B.E. 1998. Currently, there are 1,472 employees representatives on the Welfare Committee, accounting for 100% of all employees. Quarterly meetings are held for discussions. In 2024, the following proposed suggestions were approved for further action:
Promoting equal opportunities and diversity in the workforce
The Company values diversity and differences among employees, based on non-discrimination of race, religion, gender, skin color, language, age, and including persons with disabilities. The Company treats all employees equally, promotes equal opportunities for employment, development, and career advancement. The Company supports job creation by employing people with disabilities in suitable positions. Additionally, the Company organizes continuous campaigns to provide opportunities for employees to participate, exchange opinions, and promote equality and diversity. It encourages all personnel to fully demonstrate their potential, as well as promoting efforts to reduce disparities both inside and outside the organization through diverse feedback from societal groups. This will help reduce discrimination and harassment in all forms during business operations.
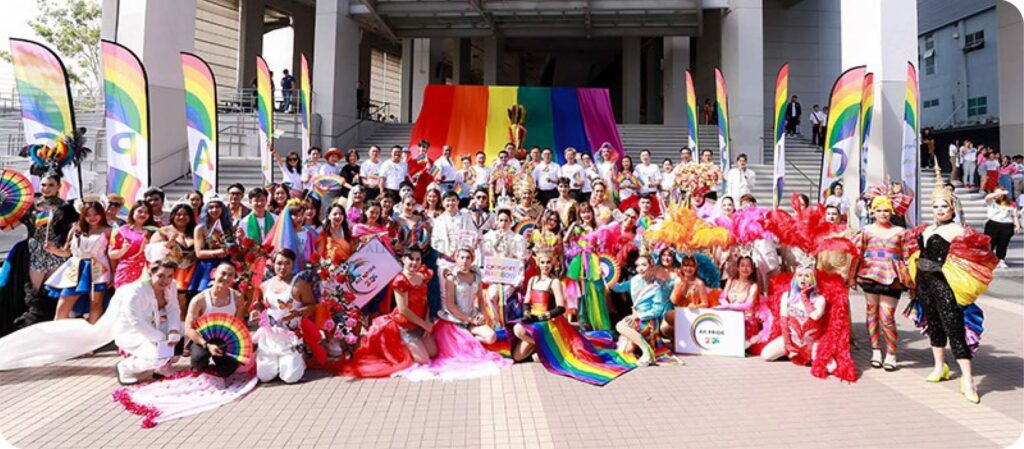
In 2024, the Company organized the ALL PRIDE 2024 event: Diversity, Equity, Sustainability, under the theme of Diversity, Equity, and Inclusion. The event included a parade, seminars sharing ideas and life experiences from influencers, a fashion and idea presentation contest reflecting the theme ‘Diversity, Equity, and Inclusion,’ and booths selling products from suppliers. Additionally, the Company collaborated with Teayii, or Teayi- Prapassorn Kanjanasoot, to design the ‘Pride Collection’ products, which were sold at all 7-Eleven stores nationwide during Pride Month, such as canvas bags from 7-Eleven x Teayii, water bottles, umbrellas, socks, etc. The proceeds, after expenses, were donated to the Thai Red Cross, totaling 3.5 million Baht.
Additionally, the Company, under the operation of CPRAM, provides opportunities for foreign employees to showcase their talents and participate in the Company’s key activities with equal rights to Thai employees. These activities include foreign employee cooking contests with dishes such as Lok Lak and Waat Sarr Hainn, and the Songkran beauty queen contest, among others.
Living Wage
The Company values employees as a key pillar that drives business success. To ensure employees are well taken care of, the Company provides benefits, a good working environment, and a safe workplace, as well as fair compensation. This is achieved through policies and guidelines for managing compensation and benefits, as well as considering fair and equitable salaries and benefits for employees and business partners (store partners) in each area. The Company strictly adheres to legal requirements and sets competitive compensation compared to the industry. Additionally, the Company provides support and compensation that exceed the minimum wage set by law, including additional payments for expenses such as overtime, travel, special allowances, housing, meals, and attendance bonuses, ensuring employees receive compensation suitable for a decent living.
The Company has established a process for evaluating compensation and benefits in collaboration with leading global consulting firms, including Korn Ferry Hay Group and the Personnel Management Association of Thailand (PMAT), a leading human resources management professional association in Thailand. Additionally, the Company analyzes the impact of changes in the cost of living and employment factors in various aspects of the business. The goal is to ensure 100% coverage of all employees by 2025. There are also plans to expand the evaluation to include suppliers and contractors in the future to ensure that the Company offers fair and competitive compensation and benefits.
Routinely monitor the gender pay gap to achieve equal remuneration for men and women
The company is committed to creating equality by routinely monitoring and analyzing the gender pay gap on an annual basis, to ensure employees receive fair compensation for work of equal value.
This process includes:
Living Wage Assessment Coverage
CPALL informs all contractors ,suppliers and franchisee on the living wage guidelines. In 2024, more than 75% of CPALL's own operations, suppliers, contractors and franchisees have been assessed on living wage.
Flexible Work Arrangement Program
The Company works to create a work-life balance for employees by allowing office staff to choose work hours that align with their lifestyle, within the time frame set by the Company, as follows:

flexible working
hours
07.30-17.00
08.00-17.30
08.30-18.00
09.00-18.30
09.30-19.00
The Company has implemented flexible work policies, allowing employees to choose their work location (Work from Anywhere) and the option to work from home (Work from Home) up to 3 days per week. The Company has developed a support system that allows employees to communicate and access work resources efficiently, such as online meetings via platforms like Webex, BlueJeans, Microsoft Teams, and Zoom. Additionally, internal communication systems like CPALL Connect and True Virtual Connect are used. The Company also encourages employees to use laptops equipped with Company software rather than desktop computers to increase convenience and flexibility in working anytime, anywhere.
In addition, in cases where employees have necessary reasons or responsibilities such as taking care of family, their health, or their education, which prevent them from working full-time as specified in the employment contract, employees can discuss and seek approval from their supervisor and request approval from the highest management of the department to adjust the workdays and hours, including a suitable and reasonable timeframe that aligns with the employees’ responsibilities. This adjustment is subject to the Company’s rules and procedures, while maintaining their employment status and receiving proportional pay based on the actual days and hours worked (Part-time working options).
Other Information
Performance Data of Human Resources
| GRI Standard | Required Data | Unit | 2019 |
2020 |
2021 |
2022 |
|||||||||||||
| Male | Female | Total | Male | Female | Total | Male | Female | Total | Male | Female | Total | ||||||||
| 2 | Workforce | ||||||||||||||||||
| 2-7 | Total Employee | Persons | 30,670 | 62,641 | 93,311 | 34,585 | 67,642 | 102,227 | 54,820 | 99,613 | 154,433 | 59,367 | 108,034 | 167,401 | |||||
| FTE | N/A | N/A | N/A | N/A | N/A | N/A | 51,558 | 90,465 | 142,023 | 57,057 | 99,797 | 156,854 | |||||||
| 2-7a | By Based Location | ||||||||||||||||||
| - Thailand | Persons | N/A | N/A | N/A | N/A | N/A | N/A | N/A | N/A | N/A | 57,493 | 106,117 | 163,610 | ||||||
| FTE | N/A | N/A | N/A | N/A | N/A | N/A | N/A | N/A | N/A | 54,792 | 97,482 | 152,274 | |||||||
| - Cambodia | Persons | N/A | N/A | N/A | N/A | N/A | N/A | N/A | N/A | N/A | 629 | 623 | 1,252 | ||||||
| FTE | N/A | N/A | N/A | N/A | N/A | N/A | N/A | N/A | N/A | 762 | 757 | 1,519 | |||||||
| - Malaysia | Persons | N/A | N/A | N/A | N/A | N/A | N/A | N/A | N/A | N/A | 1 | 0 | 1 | ||||||
| FTE | N/A | N/A | N/A | N/A | N/A | N/A | N/A | N/A | N/A | 1 | 0 | 1 | |||||||
| - Other | Persons | N/A | N/A | N/A | N/A | N/A | N/A | N/A | N/A | N/A | 1,244 | 1,294 | 2,538 | ||||||
| FTE | N/A | N/A | N/A | N/A | N/A | N/A | N/A | N/A | N/A | 1,501 | 1,558 | 3,059 | |||||||
| 2-7b | By Employment Contract | ||||||||||||||||||
| - Permanent Employee | Persons | 30,670 | 62,641 | 93,311 | 34,585 | 67,642 | 102,227 | 54,820 | 99,613 | 154,433 | 58,561 | 107,086 | 165,647 | ||||||
| FTE | N/A | N/A | N/A | N/A | N/A | N/A | N/A | N/A | N/A | 56,253 | 98,859 | 155,112 | |||||||
| - Temporaly Employee | Persons | N/A | N/A | N/A | N/A | N/A | N/A | N/A | N/A | N/A | 806 | 948 | 1,754 | ||||||
| FTE | N/A | N/A | N/A | N/A | N/A | N/A | N/A | N/A | N/A | 803 | 938 | 1,741 | |||||||
| 405-4 | Diversity of employees | ||||||||||||||||||
| By Management Level | |||||||||||||||||||
| - Top Management | Persons | 41 | 21 | 62 | 32 | 24 | 56 | 95 | 57 | 152 | 96 | 56 | 152 | ||||||
| - Management | Persons | 937 | 1,218 | 2,155 | 1,259 | 1,591 | 2,850 | 1,614 | 1,946 | 3,560 | 1,656 | 2,173 | 3,829 | ||||||
| - Junior Management | Persons | 2,897 | 4,456 | 7,353 | 3,218 | 5,018 | 8,236 | ||||||||||||
| - Officer | Persons | 29,692 | 61,402 | 91,094 | 33,294 | 66,027 | 99,321 | 50,214 | 93,154 | 143,368 | 54,397 | 100,787 | 155,184 | ||||||
| By Nationality | |||||||||||||||||||
| - Thailand | Persons | N/A | N/A | N/A | N/A | N/A | N/A | 53,304 | 98,069 | 151,373 | 57,490 | 106,119 | 163,609 | ||||||
| - Cambodia | Persons | N/A | N/A | N/A | N/A | N/A | N/A | N/A | N/A | 730 | 629 | 623 | 1,252 | ||||||
| - Burmese | Persons | N/A | N/A | N/A | N/A | N/A | N/A | N/A | N/A | 2,227 | 1,171 | 1,282 | 2,453 | ||||||
| - Indian | Persons | N/A | N/A | N/A | N/A | N/A | N/A | N/A | N/A | 2 | 35 | 3 | 38 | ||||||
| - Austrian | Persons | N/A | N/A | N/A | N/A | N/A | N/A | N/A | N/A | 0 | 2 | 1 | 3 | ||||||
| - Korean | Persons | N/A | N/A | N/A | N/A | N/A | N/A | N/A | N/A | 5 | 1 | 0 | 1 | ||||||
| - Other | Persons | N/A | N/A | N/A | N/A | N/A | N/A | N/A | N/A | 96 | 39 | 6 | 45 | ||||||
| By Age | |||||||||||||||||||
| - Under 30 years old | Persons | 16,875 | 35,700 | 52,575 | 18,218 | 37,306 | 55,524 | 30,024 | 54,906 | 84,930 | 33,149 | 60,148 | 93,297 | ||||||
| FTE | N/A | N/A | N/A | N/A | N/A | N/A | N/A | N/A | N/A | 31,655 | 54,984 | 86,639 | |||||||
| - 30-50 years old | Persons | 13,224 | 25,907 | 39,131 | 15,717 | 29,203 | 44,920 | 23,680 | 42,953 | 66,633 | 24,932 | 45,799 | 70,731 | ||||||
| FTE | N/A | N/A | N/A | N/A | N/A | N/A | N/A | N/A | N/A | 24,138 | 42,750 | 66,888 | |||||||
| - Over 50 years old | Persons | 571 | 1,034 | 1,605 | 650 | 1,133 | 1,783 | 1,116 | 1,754 | 2,870 | 1,286 | 2,087 | 3,373 | ||||||
| FTE | N/A | N/A | N/A | N/A | N/A | N/A | N/A | N/A | N/A | 1,264 | 2,063 | 3,327 | |||||||
| By Religion | |||||||||||||||||||
| - Buddhist | Persons | N/A | N/A | 87,989 | N/A | N/A | 96,180 | 33,566 | 63,637 | 97,203 | 38,349 | 72,836 | 111,185 | ||||||
| FTE | N/A | N/A | N/A | N/A | N/A | N/A | N/A | N/A | N/A | 36,199 | 65,224 | 101,422 | |||||||
| - Christian | Persons | N/A | N/A | 532 | N/A | N/A | 599 | 278 | 356 | 634 | 298 | 403 | 701 | ||||||
| FTE | N/A | N/A | N/A | N/A | N/A | N/A | N/A | N/A | N/A | 279 | 362 | 641 | |||||||
| - Islamic | Persons | N/A | N/A | 4,725 | N/A | N/A | 4,882 | 1,505 | 3,348 | 4,853 | 1,933 | 4,466 | 6,399 | ||||||
| FTE | N/A | N/A | N/A | N/A | N/A | N/A | N/A | N/A | N/A | 1,823 | 3,950 | 5,773 | |||||||
| - Hindu | Persons | N/A | N/A | N/A | N/A | N/A | N/A | 5 | 3 | 8 | 6 | 3 | 9 | ||||||
| FTE | N/A | N/A | N/A | N/A | N/A | N/A | N/A | N/A | N/A | 6 | 3 | 9 | |||||||
| - Other | Persons | N/A | N/A | N/A | N/A | N/A | N/A | 22 | 40 | 62 | 14 | 21 | 35 | ||||||
| FTE | N/A | N/A | N/A | N/A | N/A | N/A | N/A | N/A | N/A | 13 | 18 | 30 | |||||||
| - Not disclosed | Persons | N/A | N/A | 65 | N/A | N/A | 566 | 19,444 | 32,229 | 51,673 | 18,767 | 30,305 | 49,072 | ||||||
| FTE | N/A | N/A | N/A | N/A | N/A | N/A | N/A | N/A | N/A | 18,737 | 30,241 | 48,978 | |||||||
| 2-8a | Workers | Persons | 17,489 | 12,094 | 29,583 | 32,325 | 56,928 | 89,253 | 19,563 | 32,146 | 51,709 | 2,467 | 1,361 | 3,828 | |||||
| 401-1 | New Employee Hires | ||||||||||||||||||
| - Number of new hires | Persons | 16,827 | 30,911 | 47,738 | 13,767 | 26,586 | 40,353 | 33,670 | 58,673 | 92,343 | 36,230 | 63,223 | 99,453 | ||||||
| - New hire rate | % | 38.84 | 21.07 | 59.79 | 59.41 | ||||||||||||||
| By Age | |||||||||||||||||||
| - Under 30 years old | Persons | 38,852 | 33,119 | 27,102 | 45,360 | 72,462 | 30,217 | 50,945 | 81,162 | ||||||||||
| - 30-50 years old | Persons | 8,772 | 7,134 | 6,510 | 13,155 | 19,665 | 5,924 | 12,166 | 18,090 | ||||||||||
| - Over 50 years old | Persons | 114 | 100 | 58 | 158 | 216 | 89 | 112 | 201 | ||||||||||
| By Nationality | |||||||||||||||||||
| - Thailand | Persons | N/A | N/A | N/A | N/A | N/A | N/A | 32,843 | 58,054 | 90,897 | 35,511 | 62,537 | 98,048 | ||||||
| - Cambodia | Persons | N/A | N/A | N/A | N/A | N/A | N/A | 60 | 68 | 128 | 438 | 373 | 811 | ||||||
| - Burmese | Persons | N/A | N/A | N/A | N/A | N/A | N/A | 752 | 248 | 1,300 | 236 | 307 | 543 | ||||||
| - Indian | Persons | N/A | N/A | N/A | N/A | N/A | N/A | 1 | 0 | 1 | 30 | 3 | 33 | ||||||
| - Austrian | Persons | N/A | N/A | N/A | N/A | N/A | N/A | 0 | 0 | 0 | 1 | 0 | 1 | ||||||
| - Korean | Persons | N/A | N/A | N/A | N/A | N/A | N/A | 2 | 0 | 2 | 1 | 0 | 1 | ||||||
| - Other | Persons | N/A | N/A | N/A | N/A | N/A | N/A | 12 | 3 | 15 | 13 | 3 | 16 | ||||||
| By Management Level | |||||||||||||||||||
| - Top Management | Persons | N/A | N/A | N/A | N/A | N/A | N/A | 9 | 5 | 14 | 8 | 4 | 12 | ||||||
| - Management | Persons | N/A | N/A | N/A | N/A | N/A | N/A | 192 | 216 | 408 | 243 | 318 | 561 | ||||||
| - Junior Management | Persons | N/A | N/A | N/A | N/A | N/A | N/A | 149 | 361 | 510 | 319 | 451 | 770 | ||||||
| - Officer | Persons | N/A | N/A | N/A | N/A | N/A | N/A | 33,320 | 58,091 | 91,411 | 35,660 | 62,450 | 98,110 | ||||||
| 401-1 | Turnover | ||||||||||||||||||
| - Total number of resigned employees | Persons | 14,902 | 24,019 | 38,921 | 12,022 | 23,086 | 35,108 | 28,774 | 52,148 | 80,922 | 36,743 | 61,456 | 98,199 | ||||||
| - Turnover Rate | % | 41.71 | 34.34 | 52.40 | 58.66 | ||||||||||||||
| By Age | |||||||||||||||||||
| - Under 30 years old | Persons | N/A | N/A | 30,012 | N/A | N/A | 26,996 | 22,826 | 40,197 | 63,023 | 28,849 | 46,631 | 75,480 | ||||||
| - 30-50 years old | Persons | N/A | N/A | 8,753 | N/A | N/A | 7,871 | 5,827 | 11,730 | 17,557 | 7,687 | 14,525 | 22,212 | ||||||
| - Over 50 years old | Persons | N/A | N/A | 156 | N/A | N/A | 241 | 121 | 221 | 342 | 207 | 300 | 507 | ||||||
| By Nationality | |||||||||||||||||||
| - Thailand | Persons | N/A | N/A | N/A | N/A | N/A | N/A | 28,437 | 51,804 | 80,241 | 36,349 | 61,112 | 97,461 | ||||||
| - Cambodia | Persons | N/A | N/A | N/A | N/A | N/A | N/A | 131 | 157 | 288 | 177 | 168 | 345 | ||||||
| - พม่า | Persons | N/A | N/A | N/A | N/A | N/A | N/A | 205 | 186 | 391 | 206 | 174 | 380 | ||||||
| - Indian | Persons | N/A | N/A | N/A | N/A | N/A | N/A | 0 | 0 | 0 | 3 | 0 | 3 | ||||||
| - Austrian | Persons | N/A | N/A | N/A | N/A | N/A | N/A | 1 | 0 | 1 | 0 | 0 | 0 | ||||||
| - Korean | Persons | N/A | N/A | N/A | N/A | N/A | N/A | 0 | 0 | 0 | 0 | 0 | 0 | ||||||
| - Other | Persons | N/A | N/A | N/A | N/A | N/A | N/A | 0 | 1 | 1 | 8 | 2 | 10 | ||||||
| By Management Level | |||||||||||||||||||
| - Top Management | Persons | N/A | N/A | N/A | N/A | N/A | N/A | N/A | N/A | N/A | 18 | 17 | 35 | ||||||
| - Management | Perons | N/A | N/A | N/A | N/A | N/A | N/A | N/A | N/A | N/A | 274 | 360 | 634 | ||||||
| - Junior Management | Persons | N/A | N/A | N/A | N/A | N/A | N/A | N/A | N/A | N/A | 634 | 975 | 1,609 | ||||||
| - Officer | Persons | N/A | N/A | N/A | N/A | N/A | N/A | N/A | N/A | N/A | 37,232 | 62,220 | 99,452 | ||||||
| 401-1 | Voluntary Turnover | ||||||||||||||||||
| - Number of voluntarily resigned employees | Persons | N/A | N/A | N/A | N/A | N/A | N/A | 26,340 | 48,587 | 74,927 | 31,669 | 55,312 | 86,981 | ||||||
| - Voluntary resignation rate | % | 38.08 | 32.90 | 48.52 | 51.96 | ||||||||||||||
| By Age | |||||||||||||||||||
| - Under 30 years old | Persons | N/A | N/A | N/A | N/A | N/A | N/A | 20,950 | 37,589 | 58,539 | 25,060 | 42,439 | 67,499 | ||||||
| - 30-50 years old | Persons | N/A | N/A | N/A | N/A | N/A | N/A | 5,317 | 10,849 | 16,166 | 6,452 | 12,670 | 19,122 | ||||||
| - Over 50 years old | Persons | N/A | N/A | N/A | N/A | N/A | N/A | 73 | 149 | 222 | 157 | 203 | 360 | ||||||
| By Nationality | |||||||||||||||||||
| - Thailand | Persons | N/A | N/A | N/A | N/A | N/A | N/A | 26,005 | 48,243 | 74,248 | 31,277 | 54,969 | 86,246 | ||||||
| - Cambodia | Persons | N/A | N/A | N/A | N/A | N/A | N/A | 130 | 157 | 287 | 177 | 168 | 345 | ||||||
| - Burmese | Persons | N/A | N/A | N/A | N/A | N/A | N/A | 204 | 186 | 390 | 204 | 173 | 377 | ||||||
| - Indian | Persons | N/A | N/A | N/A | N/A | N/A | N/A | 0 | 0 | 0 | 3 | 0 | 3 | ||||||
| - Austrian | Persons | N/A | N/A | N/A | N/A | N/A | N/A | 1 | 0 | 1 | 0 | 0 | 0 | ||||||
| - Korean | Persons | N/A | N/A | N/A | N/A | N/A | N/A | 0 | 0 | 0 | 0 | 0 | 0 | ||||||
| - Other | Persons | N/A | N/A | N/A | N/A | N/A | N/A | 0 | 1 | 1 | 8 | 2 | 10 | ||||||
| By Management Level | |||||||||||||||||||
| - Top Management | Persons | N/A | N/A | N/A | N/A | N/A | N/A | N/A | N/A | N/A | 12 | 16 | 28 | ||||||
| - Management | Persons | N/A | N/A | N/A | N/A | N/A | N/A | N/A | N/A | N/A | 244 | 324 | 568 | ||||||
| - Junior Management | Persons | N/A | N/A | N/A | N/A | N/A | N/A | N/A | N/A | N/A | 58 | 854 | 1,412 | ||||||
| - Officer | Persons | N/A | N/A | N/A | N/A | N/A | N/A | N/A | N/A | N/A | 30,855 | 54,118 | 84,973 | ||||||
| 401-3 | Parental Leave | ||||||||||||||||||
| 401-3a | - Number of employees entitled to maternity leave/ child care | Persons | N/A | N/A | N/A | N/A | N/A | N/A | N/A | N/A | N/A | 50,705 | 107,073 | 157,778 | |||||
| 401-3b | - Number of employees taking parental leave | Persons | N/A | N/A | 2,959 | N/A | N/A | 3,592 | 556 | 4,598 | 5,154 | 785 | 4,546 | 5,331 | |||||
| 401-3c | - Number of employees returned to work after parental leave | Persons | N/A | N/A | 2,615 | N/A | N/A | 3,225 | 518 | 4,374 | 4,892 | 773 | 3,977 | 4,750 | |||||
| 401-3d | - Number of employees returned to work after parental leave and were still employed up to 12 months | Persons | N/A | N/A | N/A | N/A | N/A | N/A | N/A | 2,485 | 2,485 | 597 | 3,368 | 3,965 | |||||
| 401-3e | - Retention rate of employees taking parental leave | % | 88.37 | 89.78 | 10.05 | 84.87 | 94.92 | 14.50 | 74.60 | 89.10 | |||||||||
| Collective Bargaining Agreements | |||||||||||||||||||
| - Employee Representative under welfare committee | % | 100 | 100 | 100 | 100 | ||||||||||||||